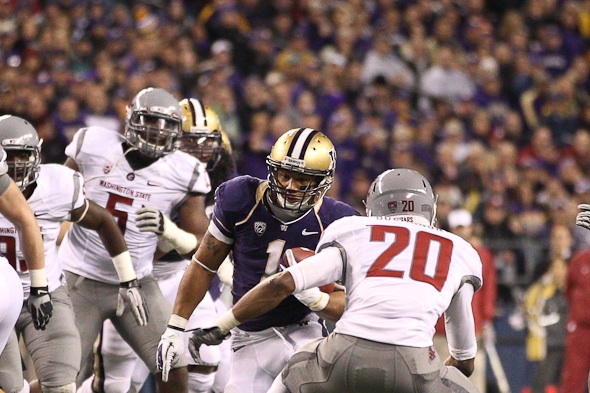
The Washington-Baylor Alamo Bowl matchup Dec. 29 will feature two high-scoring offenses, but Baylor overwhelms the Huskies when it comes to putting points on the scoreboard. In 2011, Baylor scored 71 touchdowns to Washington’s 49. Check out the differences in rushing yards, passing yards and total offense, and you’ll see that the Bears present a formidable task for Steve Sarkisian’s Huskies.
| TEAM STATS | WASH/OPP | BAYLOR/OPP |
|---|---|---|
| SCORING | 378/400 | 522/428 |
| Points Per Game | 31.5/33.3 | 43.5/35.7 |
| FIRST DOWNS | 248/264 | 344/292 |
| Rushing | 93/90 | 157/117 |
| Passing | 133/153 | 162/147 |
| Penalty | 22/21 | 25/28 |
| RUSHING YARDS | 1824/1711 | 2581/2384 |
| Yards Gained | 2090/1999 | 2866/2628 |
| Yards Lost | 266/288 | 285/244 |
| Attempts | 415/379 | 524/460 |
| Avg. Per Rush | 4.4/4.5 | 4.9/5.2 |
| Avg. Per Game | 152/142.6 | 215.1/198.7 |
| TDs Rushing | 15/24 | 29/24 |
| PASSING YARDS | 2884/3405 | 4274/3346 |
| Comp-Att. | 244-369/281-453 | 283-391/292-458 |
| Avg. Per Pass | 7.8/7.5 | 10.9/7.3 |
| Avg. Per Catch | 11.8/12.1 | 15.1/11.5 |
| Avg. Per Game | 240.3/283.8 | 356.2/278.8 |
| TDs Passing | 32/21 | 39/32 |
| TOTAL OFFENSE | 4708/5116 | 6855/5730 |
| Total Plays | 784/832 | 915/918 |
| Avg. Per Play | 6.0/6.1 | 7.5/6.2 |
| Avg. Per Game | 392.3/426.3 | 571.2/477.5 |
| KICK RETURNS: #-YARDS | 66-156361/1451 | 54-1096/64-1402 |
| PUNT RETURNS: #-YARDS | 19-141/16-89 | 16-138/13-118 |
| INT RETURNS: #-YARDS | 10-51/13-322 | 16-344/6-78 |
| KICK RETURN AVG. | 23.7/23.8 | 19.6/21.9 |
| PUNT RETURN AVG. | 7.4/5.6 | 8.6/9.1 |
| INT RETURN AVG. | 5.1/24.8 | 21.5/13.0 |
| FUMBLES-LOST | 11-7/25-12 | 31-17/16-11 |
| PENALTIES-YARDS | 77-758/82-662 | 84-781/91-768 |
| Average Per Game | 63.2/55.2 | 65.1/64.0 |
| PUNTS-YARDS | 50-2152/43-1755 | 30-1169/45-1899 |
| Average Per Punt | 43.0/40.8 | 39.0/42.2 |
| Net Punt Average | 39.7/36.1 | 33.0/36.5 |
| TIME OF POSSESSION/GAME | 29:42/30:18 | 27:37:00/30:53 |
| 3RD-DOWN CONVERSIONS | 70-156/81-165 | 66/147/93-189 |
| 3rd Down Percentage | 45.0/49.0 | 45.0/49.0 |
| 4th-DOWN CONVERSIONS | 6-12/9-16 | 16-23/10-16 |
| 4th-Down Percentage | 50.0/56.0 | 70.0/62.0 |
| SACKS BY-YARDS | 24-170/34-188 | 19-130/25-157 |
| MISC. YARDS | 0/0 | 0/0 |
| TOUCHDOWNS SCORED | 49/49 | 71/56 |
| FIELD GOALS-ATTEMPTS | 11-15/19-21 | 9-16/13-18 |
| ON-SIDE KICKS | 0-2/0-1 | 0-0/1-3 |
| RED-ZONE SCORES | 40-45/50-56 | 44-58/50-60 |
| RED-ZONE TOUCHDOWNS | 36-45 /36-56 | 36-58/41-60 |
| PAT-ATTEMPTS | 49-49/45-47 | 67-70/40-57 |
